Portfolio tracking built for Canadian investors
A TFSA at one brokerage, an RRSP at another, a non-registered account with US holdings in it, and a spreadsheet somewhere trying to hold the whole thing together. Luum brings them into one view and measures that view against the index and the plan you set, using your real contributions on the dates you made them.
Starter is free forever. No credit card required.
What a Canadian tracker actually has to handle
A global portfolio tool will show you a balance and a percentage. Four things make that insufficient here, and they are the four this product is organised around.
Four account types, taxed four ways
A TFSA, an RRSP, an FHSA and a non-registered account are not interchangeable buckets. Adding them into one number hides the only thing that distinguishes them. Canadian registered account types covers what each one does.
Two currencies, converted per transaction
A US-listed holding has a Canadian-dollar cost base assembled from the rate on each purchase date. Converting once at today’s rate produces a different, wrong number, and currency movement alone creates a reportable gain.
A cost base pooled across institutions
Canada pools identical property per taxpayer, not per account, so the same ETF at two brokers shares one average cost. See cost base across two brokerages.
A plan to measure against
A balance is not a verdict. Targets and an index are what turn a number into an answer, and both have to be read across every account at once rather than one statement at a time.
Every transaction, in the currency it happened in
Allocation and drift can be built from a snapshot of what you hold today. A cost base cannot. It is assembled from the purchases behind each position, and for a US-listed holding each of those purchases converts at the rate on its own date. So the ledger keeps every trade in the currency it was made in rather than flattening it to one number at today’s rate.
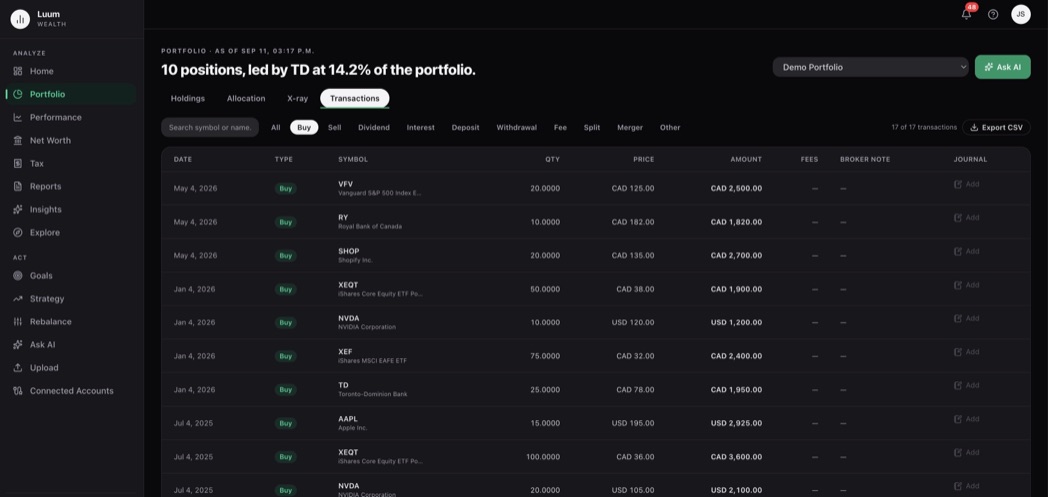
You can filter to dividends, deposits or fees, export the whole record as CSV, and try the conversion arithmetic on your own figures in the US dollar capital gain calculator.
Your targets, and how far you have drifted
You set the split you meant to hold, in the terms your plan is actually written in, and Luum tracks the gap continuously across every account and every brokerage. When you are off, the rebalance simulator computes the trades that would move you back. You place them at your brokerage yourself.
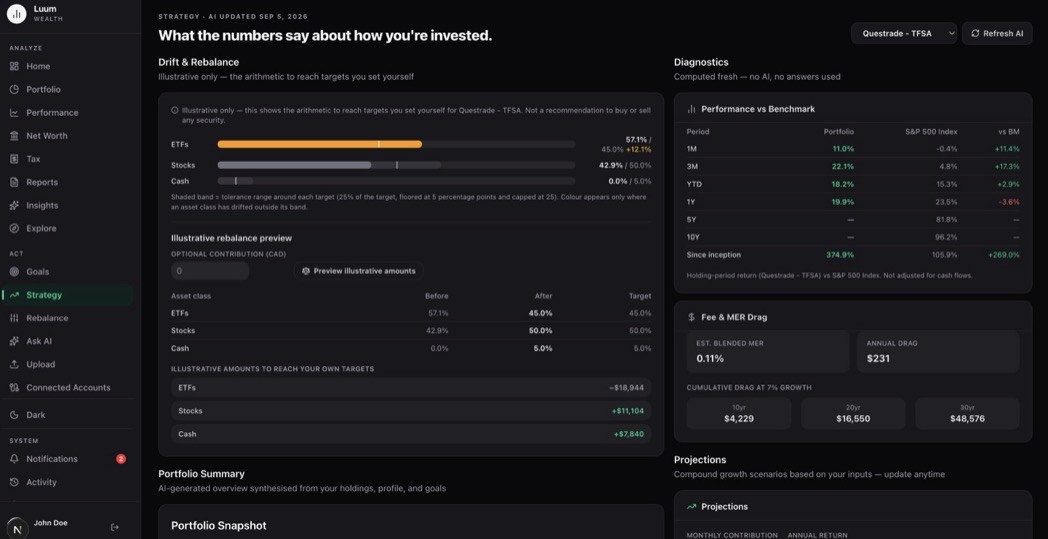
The same arithmetic is free and needs no account: the asset allocation and drift calculator runs in your browser, and its drift figure is pinned to the product’s by a build check.
Measured against the index, on your real contributions
A percentage return flatters you when you have been adding money into a rising market. Luum compares your portfolio against the index using the contributions you actually made, on the dates you made them, which is the only comparison that answers whether the plan is working rather than whether the market went up.
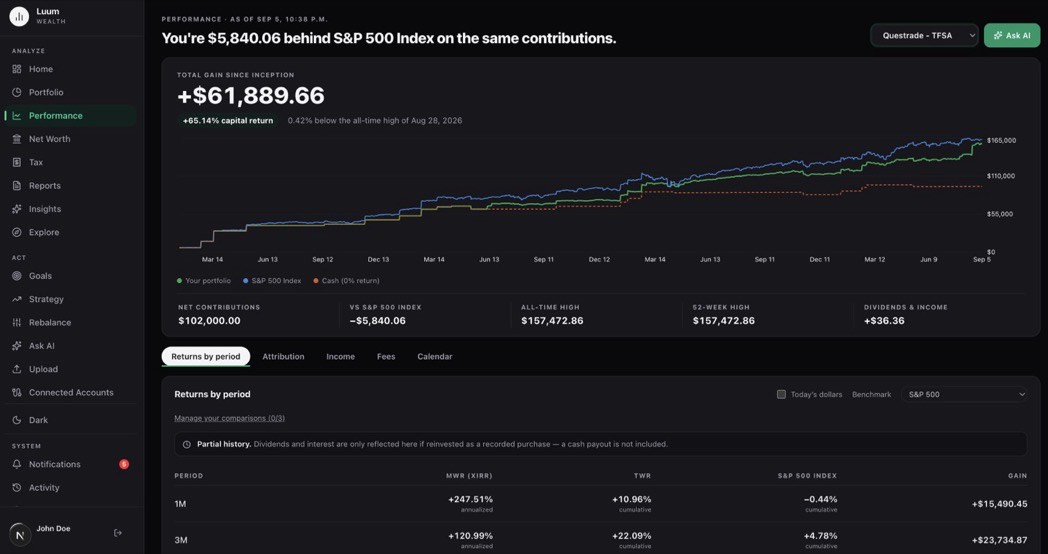
Which return you are reading matters more than most people expect. Time-weighted vs money-weighted return explains why the two answer different questions, and benchmarking your portfolio covers picking a comparison that measures selection rather than allocation.
Where to go next
- See the product if you want the screens before the argument.
- Portfolio trackers in Canada, compared is our own roundup of the field, written by a competitor and organised so every other product gets a stated case where it is the better choice.
- What Luum is and isn’t sets out the edges, including what it will not do.
- Pricing carries the plan comparison, including the limits each plan actually enforces.
Common questions
- What makes a portfolio tracker Canadian rather than generic?
- Three things a global tool usually gets wrong. Registered accounts are taxed differently from each other and from a non-registered account, so a combined view has to keep them distinct rather than adding them up. Holdings are routinely in both Canadian and US dollars, and a return that ignores the conversion is measuring the currency as well as the investment. And adjusted cost base is pooled per taxpayer across every institution, which no single brokerage can compute.
- Why can my brokerage not just show me this?
- Because it can only see the accounts it holds. No brokerage can see the same security at another institution, which is exactly what the cost base rule requires, and none of them can measure your holdings against a plan you set outside their platform. That is a structural boundary rather than a missing feature.
- Do I have to connect a brokerage to use it?
- No. Every plan takes a holdings upload, and transaction history import is available on the paid plans. Connecting is faster and keeps itself current, and connections are read-only: Luum can see positions and transactions and cannot place a trade, move cash or change a setting.
- Does it track adjusted cost base across more than one broker?
- Yes, and that is the case it is built for. Identical property is pooled per taxpayer, so the same security held at two institutions shares one average cost. Building that number needs the transaction history from both sides, which is why a holdings snapshot alone is enough for allocation but not for cost base.
- Is my data stored in Canada?
- Yes. Your data is stored in Canada, connections are read-only through Snaptrade so your credentials never reach Luum, and you can export everything you have put in whenever you want.
Bring every account into one picture
Starter is free forever. No credit card required.