AI that explains your numbers
Plain-English analysis of your own portfolio, grounded in your data. Educational only, never a stock tip.
Your accounts don’t talk to each other, and a percentage return flatters you when you’ve been adding money into a rising market. Luum brings every account into one view and measures it against the index and the plan you set, using your real contributions, on the dates you made them.
Starter is free forever. No credit card required.
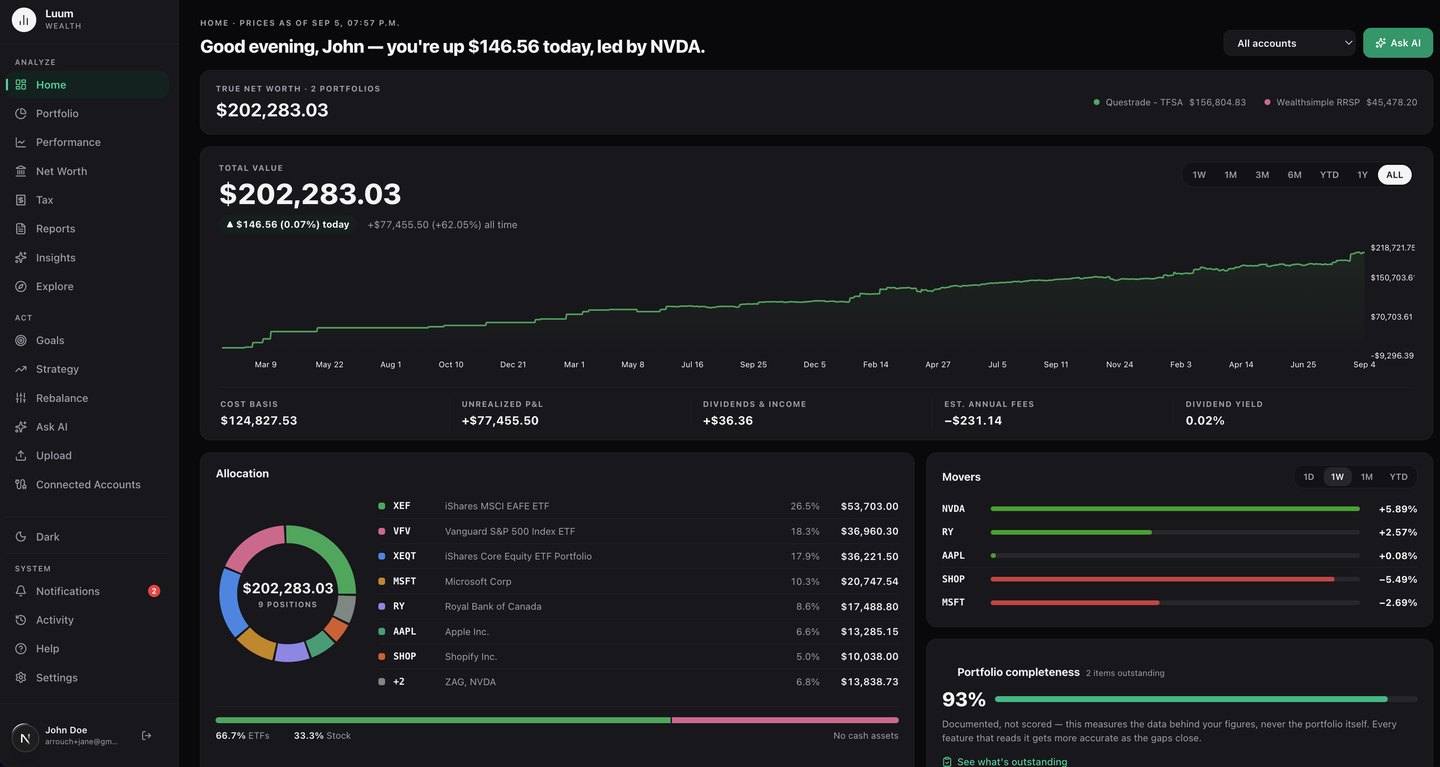
Link a brokerage read-only through Snaptrade, or bring a CSV or spreadsheet. Every import previews before it writes.
TFSA, RRSP, FHSA and taxable accounts blended into one picture, converted to a single currency, across every institution.
Set targets by asset class, region and sector. Luum measures the gap between where you are and the plan you set.
A TFSA at one brokerage, an RRSP at another, a taxable account somewhere else, and no single login shows what you actually hold. Luum brings every account into one view, converted to one currency, and shows your true allocation across all of them. It looks through your ETFs to what they actually hold, so two funds holding the same companies can’t hide a concentration.
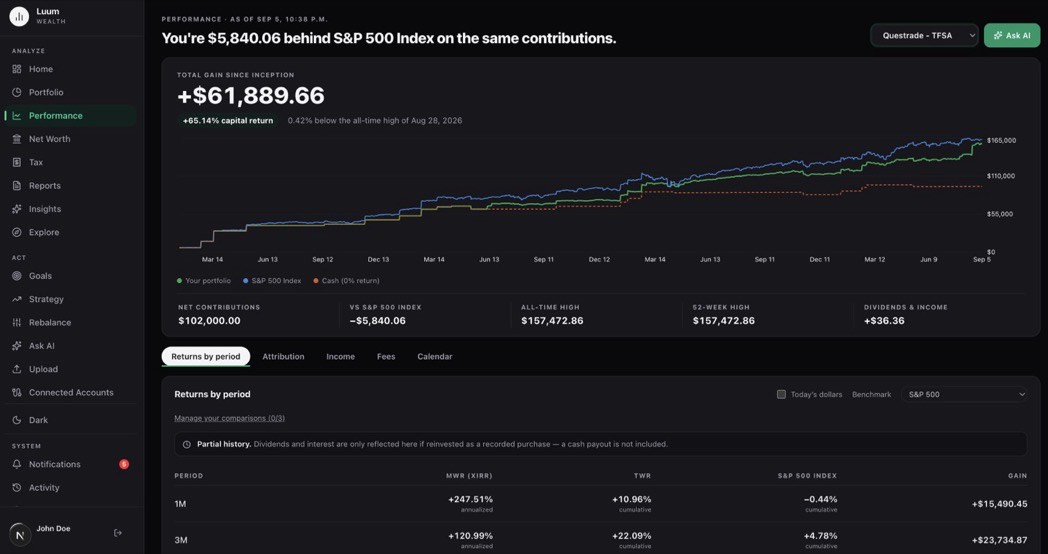
Comparing your percentage return to an index’s flatters you when you’ve been adding money into a rising market. Luum buys the comparison with your real contributions, on the dates you actually made them: against an index, against the risk-free rate, or against the region targets on your own Goals page, which asks what you’d have made had you simply held the allocation you chose. Sometimes the answer is that you’d have done better leaving it alone. It says so.
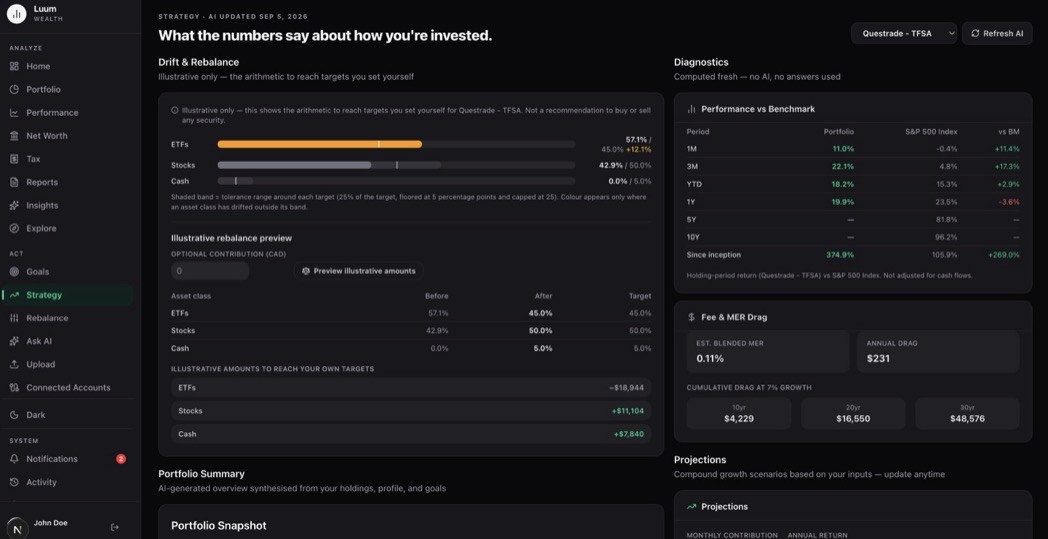
You set targets by asset class, region and sector. Luum tracks the gap between your plan and your real portfolio, flags the position that quietly grew past your comfort level, and computes the what-if trades that would move you back toward target. You place any trades yourself, at your brokerage. Luum has no order path, by design.
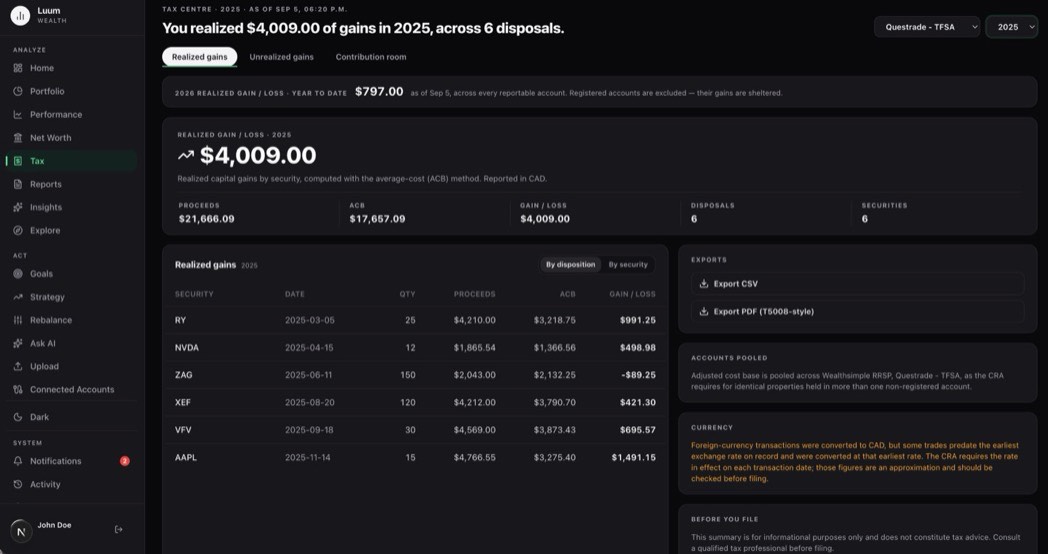
Luum computes average-cost ACB across accounts, through partial sales, year after year, accurate to your inputs, so it needs your full transaction history to be right. When you or your accountant need the numbers, you export them. Luum computes and exports; it never files anything.
Plain-English analysis of your own portfolio, grounded in your data. Educational only, never a stock tip.
Five nightly-updated scores (Risk, Value, Quality, Momentum, Dividend) for every stock and ETF you hold.
Capital gains reporting, ACB, and TFSA/RRSP contribution room. Computes and exports; you verify before filing.
Manual assets and liabilities (real estate, vehicles, crypto, mortgages) alongside your investments.
TSX and US exchanges, TFSA/RRSP/FHSA/RESP account types, CAD/USD multi-currency.
Read-only connection through Snaptrade, syncing positions and transactions automatically.
Read-only connections, via SnapTrade
 Wealthsimple
 Questrade
 TD Direct Investing
 BMO InvestorLine
 CIBC Investor's Edge
 Interactive Brokers
 Webull Canada
 AJ Bell
 Binance
 Bux
Bux Chase
Chase Citi
Citi Coinbase
 CommSec
 DEGIRO
 E*Trade
 Empower
 eToro
eToro Fidelity
 Kraken
 moomoo
 PNC
PNC Public
 Robinhood
 Schwab
 Stake Australia
 tastytrade
 TIAA
TIAA Trading212
 Transamerica
 U.S. Bank
 Upstox
 Vanguard US
 Webull US
 Wells Fargo
 Zerodha
Somewhere else? Every plan takes a holdings upload, and transaction history imports on the paid plans, so you can track any account whether or not it connects. How connections work.
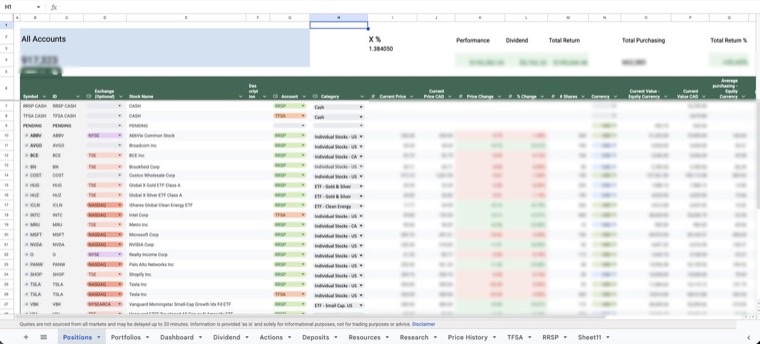
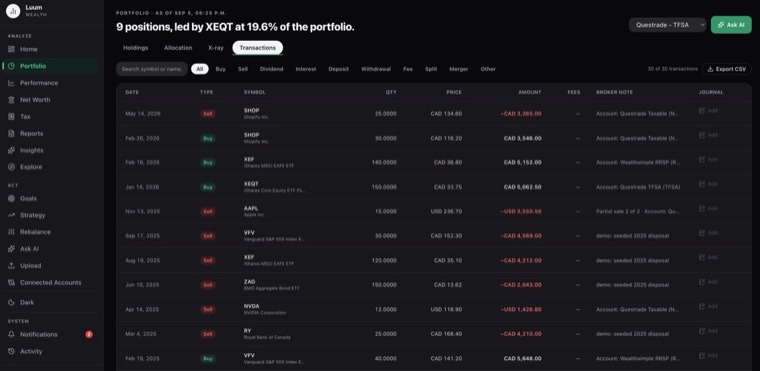
I’m a retail investor with accounts scattered across banks, brokerages, and account types; a TFSA here, an RRSP there, a taxable account somewhere else. I wanted two things at once: a close-up view of every holding, and a wide view of how it all added up against the plan I’d set for myself. I couldn’t find a tool that did both without spreadsheet gymnastics.
So I built one: a master Google Sheet, maintained by hand for years. Every trade, every dividend, every new account. It worked… if “worked” means hours of manual entry I never got back. Eventually I stopped patching the sheet and built the app instead. I’ve been running my own portfolio through it for the past year.
Luum is the tool I wanted: read-only connections to my accounts instead of copy-pasting statements, a defined strategy instead of a gut feeling, and no advice, ever. If I needed it, other investors juggling multiple accounts probably do too.
— Founder, Luum Wealth
Start on Starter, free forever. Move up whenever you want more.
Free
No card required
Free forever. No credit card, and no time limit.
Brokerage connections start on Investor.
Start free$9.90/month
Billed monthly
For active investors managing real accounts.
Everything in Starter, plus
$29/month
Billed monthly
Unlimited portfolios, AI, and tax reporting.
Everything in Investor, plus
Starter stays free for as long as you use it, and you can request a full export of your account on any plan.
All prices in CAD.
Starter is free forever and collects no card, so there is no date on which it ends. It includes one portfolio, core performance and allocation analytics, a watchlist, the Market Intelligence feed, and a demo portfolio filled with synthetic data. Your portfolios, history and data stay in your account, and you can request a full export at any time.
Yes, on your first annual subscription: cancel within 30 days of that first annual payment and we refund it in full. After that window, and on the monthly plan, cancellation takes effect at the end of the period you have already paid for and there are no pro-rated refunds for partial periods except where Canadian consumer protection law requires it. No card is collected when you sign up for Starter, so there is nothing to refund if you never subscribe.
No. Brokerage connections are read-only by construction. The integration has no trading permission to abuse, so Luum cannot place an order, move cash, or change a setting at your brokerage. There is no order path anywhere in the product, including the rebalance simulator. You place any trades yourself, at your brokerage.
Luum sees read-only positions and transactions. It never sees your brokerage credentials. You sign in on your institution’s own page and Snaptrade holds that connection. Your data is stored in Canada, in AWS’s Montréal region. Luum operators cannot see your financial data at all: the admin tools are restricted at the query layer, not just hidden in the interface.
You can request a full export of your account at any time, on any plan, and export transactions as CSV on a paid plan. Account deletion is self-serve, and there is a page showing the status of the erasure once you request it. Deleting a Luum account does not touch anything you own, because Luum holds no money and no securities.